Detection of Bus Stops From Equirectangular Panoramas - Part 1 (Computer Vision)
— code, projects, python, streetview, equirectangular, panorama, opencv, YOLOv8, computer vision, bittie, bus arrival timing — 6 min read
When developing the Bittie Bus app, one of the key features was the ability to display information about each bus stop in an intuitive format in a list of cards.
As part of this, I wanted to include a banner image at the top of each bus stop card to help users quickly orientate themselves in the real world. However, manually creating and uploading images for each of the thousands of bus stops would have been time-consuming and prone to errors.
To solve this problem, I decided to automate the process of creating these banner images. The main idea is that the automation process will label and crop the bulk of the bus stops, and manual work will need to be done to fill in the gaps on the bus stops where the automation process cannot be applied.
In this blog post, we'll discuss the challenges faced and the solution that was ultimately implemented to make this happen. We'll also cover some technical details of how I used image processing and machine learning algorithms to process the images. By the end of this post, you will have a better understanding of how automation can be used to streamline the processing of raw images to assist with improving the user experience.
The Problem
There are over 5000 bus stops in Singapore, and the network is constantly expanding. Manually creating the banners for each of them would be a tedious task. Hence, a pipeline was to be built to automate the process, especially when new bus stops are built and the dataset needs to be updated.
The Solution
The solution was to use computer vision to detect bus stops (or rather, features of a bus stop) in the panoramas fetched based on the location coordinates of the bus stops, and crop them to the necessary dimensions for the banner.
The Data
Bus stop data is publicly accessible via the LTA Datamall. The bus stop data includes the bus stop name, as well as the coordinates.
These coordinates can be used to retrieve the equirectangular panoramas from Google Street View, either through the Google Maps API, or other shady means.
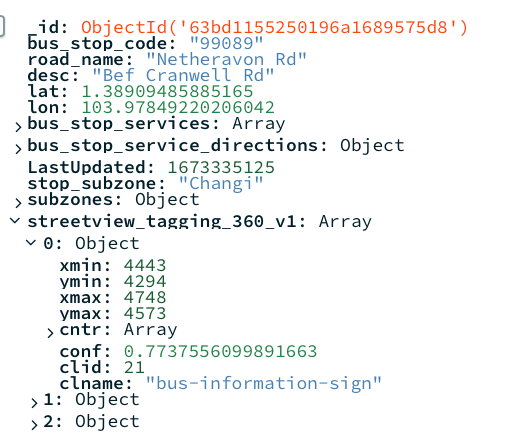
To help organise the raw data itself, as long as manage the data pipeline, a database (MongoDB) was used. The database stores information such as the stop name, coordinates, and the bounding boxes of the inference after the model has been trained.
Labelling the Data
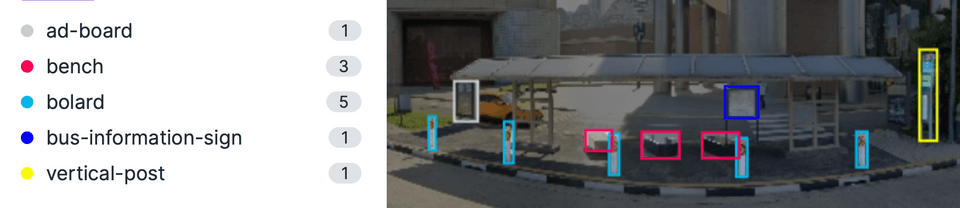
The first step was to label the data. This was done on Roboflow (an online data labelling tool) by manually going through a sample size of the panoramas, as well as importing labelled data available on Roboflow's platform. Various features of the bus stop were labelled, such as the information boards, benches, ad boards, vertical posts, as well as the safety bollards.
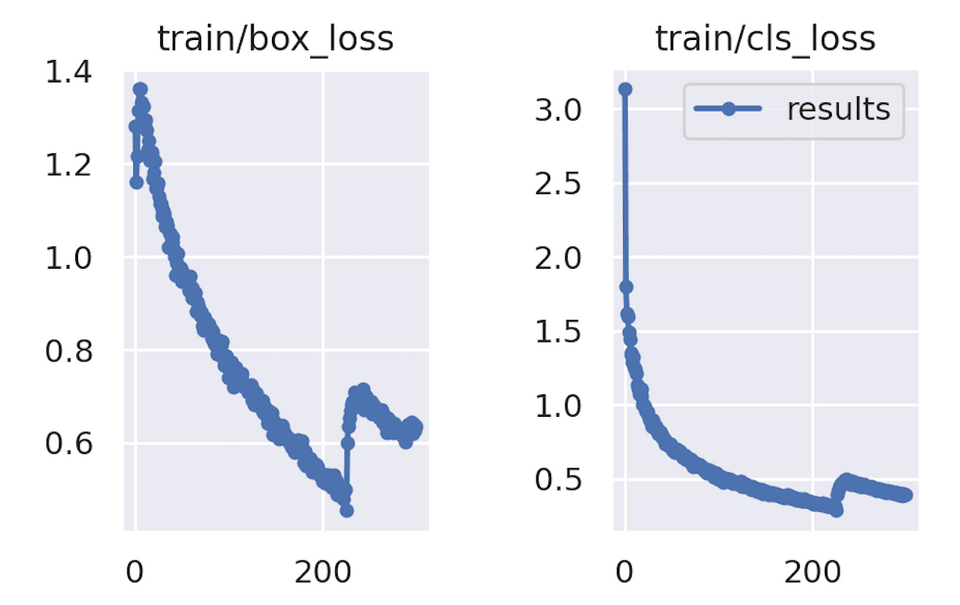
Training the Model
After the labelling is compeleted, the dataset was exported from Roboflow. Typically I would have exported it in the format for YOLOv5, but at the time of this writing, a newly released version, YOLOv8 had just gotten export support on Roboflow. Therefore, I decided it experiment with the new version.
Running Inference - First Pass
The scraped data of all the bus stop panoramas were stored on a Google Drive folder. This made it convenience to run the inference on Google Colab, as Colab comes with built in functions to mount Google Drive on the native file system. The Colab notebook would also have access to the database to save the dimensions of the detected bounding boxes.
The results of the first pass of inference were pretty good, with about 2800 bus stops being detected. For stops where the model could not detected any features of bus stops, a flag was written to the database so that it can be processes in the second pass of inference.
Running Inference - Second Pass
The second pass of inference consisted of first retrieving new coordinates of the bus stops. This was done by using the Geocoding API provided by Google to retrieve the Google Maps coordinates of the bus stop's description (e.g. "Blk 123 ABC Road"). As these coordinates were not consistent with the exact coordinates provided by the LTA, this allowed for a higher likelihood of the bus stop being detected in the panorama.
Apart from retrieving the panoramas from the Geocoded coordinates, the inference steps were similar to the first pass. Unfortunately, approximately only 500+ additional images could be tagged on the second pass.
Cropping the Images
The process of cropping the images involved identifying the central position of all the features present in the image, which then served as the central position for the banner. Prior to cropping, the image underwent de-fisheye correction to reduce its curvature and give it a more panoramic appearance. Additionally, the image was also downsized for mobile devices before cropping. Finally, when saving the image, it was saved as a progressive JPEG to allow for gradual loading on the client side.
Results & Closing Thoughts
The model performed well in detecting bus stops, with over 65% coverage (3300 out of 5000) of bus stops islandwide being accurately identified. However, the model did encounter difficulty in detecting certain bus stops, particularly in situations where:
-
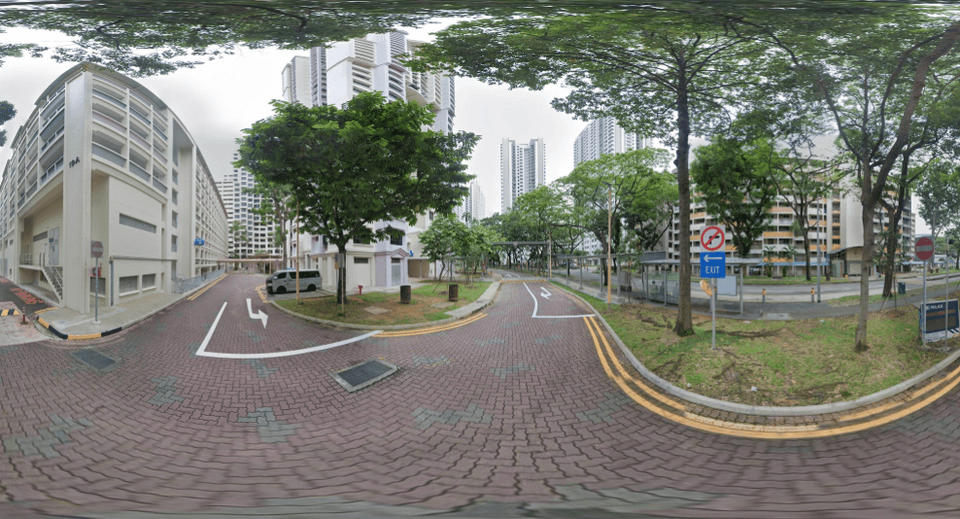
Bus stops that are not visible in the panorama (e.g. obstructed, behind a building, or the streetview imagery simply took a snapshot of a location near the bus stop such as an indoor location or service road - see below)
-
Bus stops that are not visible in the panorama due to the angle of the camera (e.g. the bus stop is behind the camera, or the camera is too far away from the bus stop)
Closing Thoughts
In conclusion, while our model performed well in detecting bus stops with over 65% coverage, there are certain instances where it encounters difficulty. These can be addressed through the use of proper coordinates or street view images, but this process can be quite tedious.
To overcome this challenge, a combination of automation and manual work would be better. Automation can handle the bulk of the bus stops, while manual effort is required to fill in the gaps. In our next blog post, we will explore ways to make the manual process more efficient. Stay tuned for more updates!